FinEd Decodes Part 3: How to Read a Company’s Profit & Loss Statement
By Deepan Datta
An explainer of how to read a company’s profit and loss statement, from revenue to net profit, using DMart’s FY26 results.
DMart’s sales grew 15.9% in FY26. So why did its profit grow only 9.7%?
A company can report rising sales and still see its profit grow more slowly. Reading the profit and loss (P&L) statement is how you spot that gap.
This is Part 3 of FinEd Decodes, our series on understanding a company. Part 1 showed how to research a company before you invest. In Part 2, How Does a Company Actually Make Money?, we looked at how a business earns. Now comes the follow-up: once you know how a business earns, how do you tell whether it earned well?
Take Avenue Supermarts, the company behind DMart. In the year ended March 2026 (FY26), its consolidated sales grew 15.9%, but its net profit grew only 9.7%, according to DMart’s results press release on NSE and Motilal Oswal’s results update.
Both numbers are true. So where did the difference go?
The answer sits in the Statement of Profit and Loss, which shows a company’s income and expenses over a period, usually a quarter or a year, and ends with the profit left for shareholders. We mean a listed company’s statement here, not the P&L report in your trading account, which only tracks your own gains and losses.
What Should You Check Before Reading a P&L?
Can you trust a number before you know what it measures? Not really.
Before reading any figure, look at the heading. It tells you the period (a full “year ended” or just a “quarter ended”), the units (lakhs or crores) and the basis.
Basis matters most. Standalone covers the legal company alone. Consolidated covers the whole group, including subsidiaries. Never mix revenue from one with profit from another.
DMart shows why. Its standalone profit grew 10.1% in FY26, per its press release, while consolidated profit grew 9.7%, because the group figure also includes subsidiaries that are still making losses.
With that settled, we can follow the money.
How Does Revenue Turn Into Profit?
Where does each rupee of sales actually go? A P&L answers this line by line.
#### Revenue is not profit
It starts with revenue from operations, which is what the company earned from selling its goods or services. That isn’t always the cash collected in the period.
Other income is listed separately. For a retailer, interest earned or a gain from selling an asset doesn’t mean it sold more goods.
#### Expenses explain the gap
Next come the costs, usually listed by type:
- Purchases: goods bought for resale.
- Change in inventories: an adjustment for stock bought but not yet sold. When a retailer builds up stock, this line is negative and reduces total expenses, because unsold goods haven’t become a cost yet.
- Employee benefits: salaries and related costs.
- Depreciation: the cost of assets spread over their useful life, not a fall in their market price.
- Finance costs: the cost of financing, which can include interest on leases.
- Other expenses: a bundle, detailed in the notes.
#### From PBT to PAT
Subtract total expenses from total income, adjust for any exceptional items, and you get profit before tax (PBT). Finance costs are already inside those expenses, so don’t subtract interest again.
Deduct tax expense, which isn’t always the tax paid in cash, and you reach profit after tax (PAT).
One more line you’ll see is earnings per share (EPS): profit attributable to equity shareholders divided by the weighted average number of equity shares. It isn’t a dividend or a share price. It matters again in why the price-to-earnings (P/E) ratio is such an important metric.
But now we have several “profits” on the page. Which one do people mean?
Why Are There So Many Different Profit Numbers?
Ever noticed headlines quoting different profit numbers for the same company? That’s because there are several.
Gross profit is revenue minus the cost of goods sold, before other operating costs, financing and tax. Many Indian statements list expenses by type, so you may not see it at all.
EBITDA is earnings before interest, tax, depreciation and amortisation. It is neither PAT nor cash.
Operating profit and EBIT (earnings before interest and tax) sound similar but can include different items. Companies may also define their own measures. DMart, for example, has defined EBITDA in its investor presentations as profit before tax plus depreciation and finance costs, minus other income. We’ll call it company-defined EBITDA. For FY26, that works out to ₹4,082 + ₹1,037 + ₹142 - ₹74 = ₹5,187 crore.
The rule is simple: check the definition before you compare.
How Do You Compare a P&L With Last Year’s?
A single year tells you little. So what happens when you put it next to the last one?
Ask yourself:
- Did revenue and profit grow at a similar pace?
- Out of each rupee of sales, did more or less remain as profit?
- Which expenses grew faster than sales?
- Did other income, tax changes or exceptional items shape the result?
A shifting margin is a clue, not a verdict. It can come from pricing, product mix, expansion spending or competition. And “exceptional” doesn’t mean an item can never return.
Ideally, check three to five comparable years. Let’s try this on DMart.
What Did DMart’s P&L Show in FY26?
Here are DMart’s consolidated figures in ₹ crore, rounded, from its FY26 results as compiled in Motilal Oswal’s update:
- Sales: 59,358 to 68,821 (up 15.9%)
- Company-defined EBITDA: 4,487 to 5,187 (up 15.6%)
- PBT: 3,673 to 4,082 (up 11.1%)
- PAT: 2,707 to 2,970 (up 9.7%)
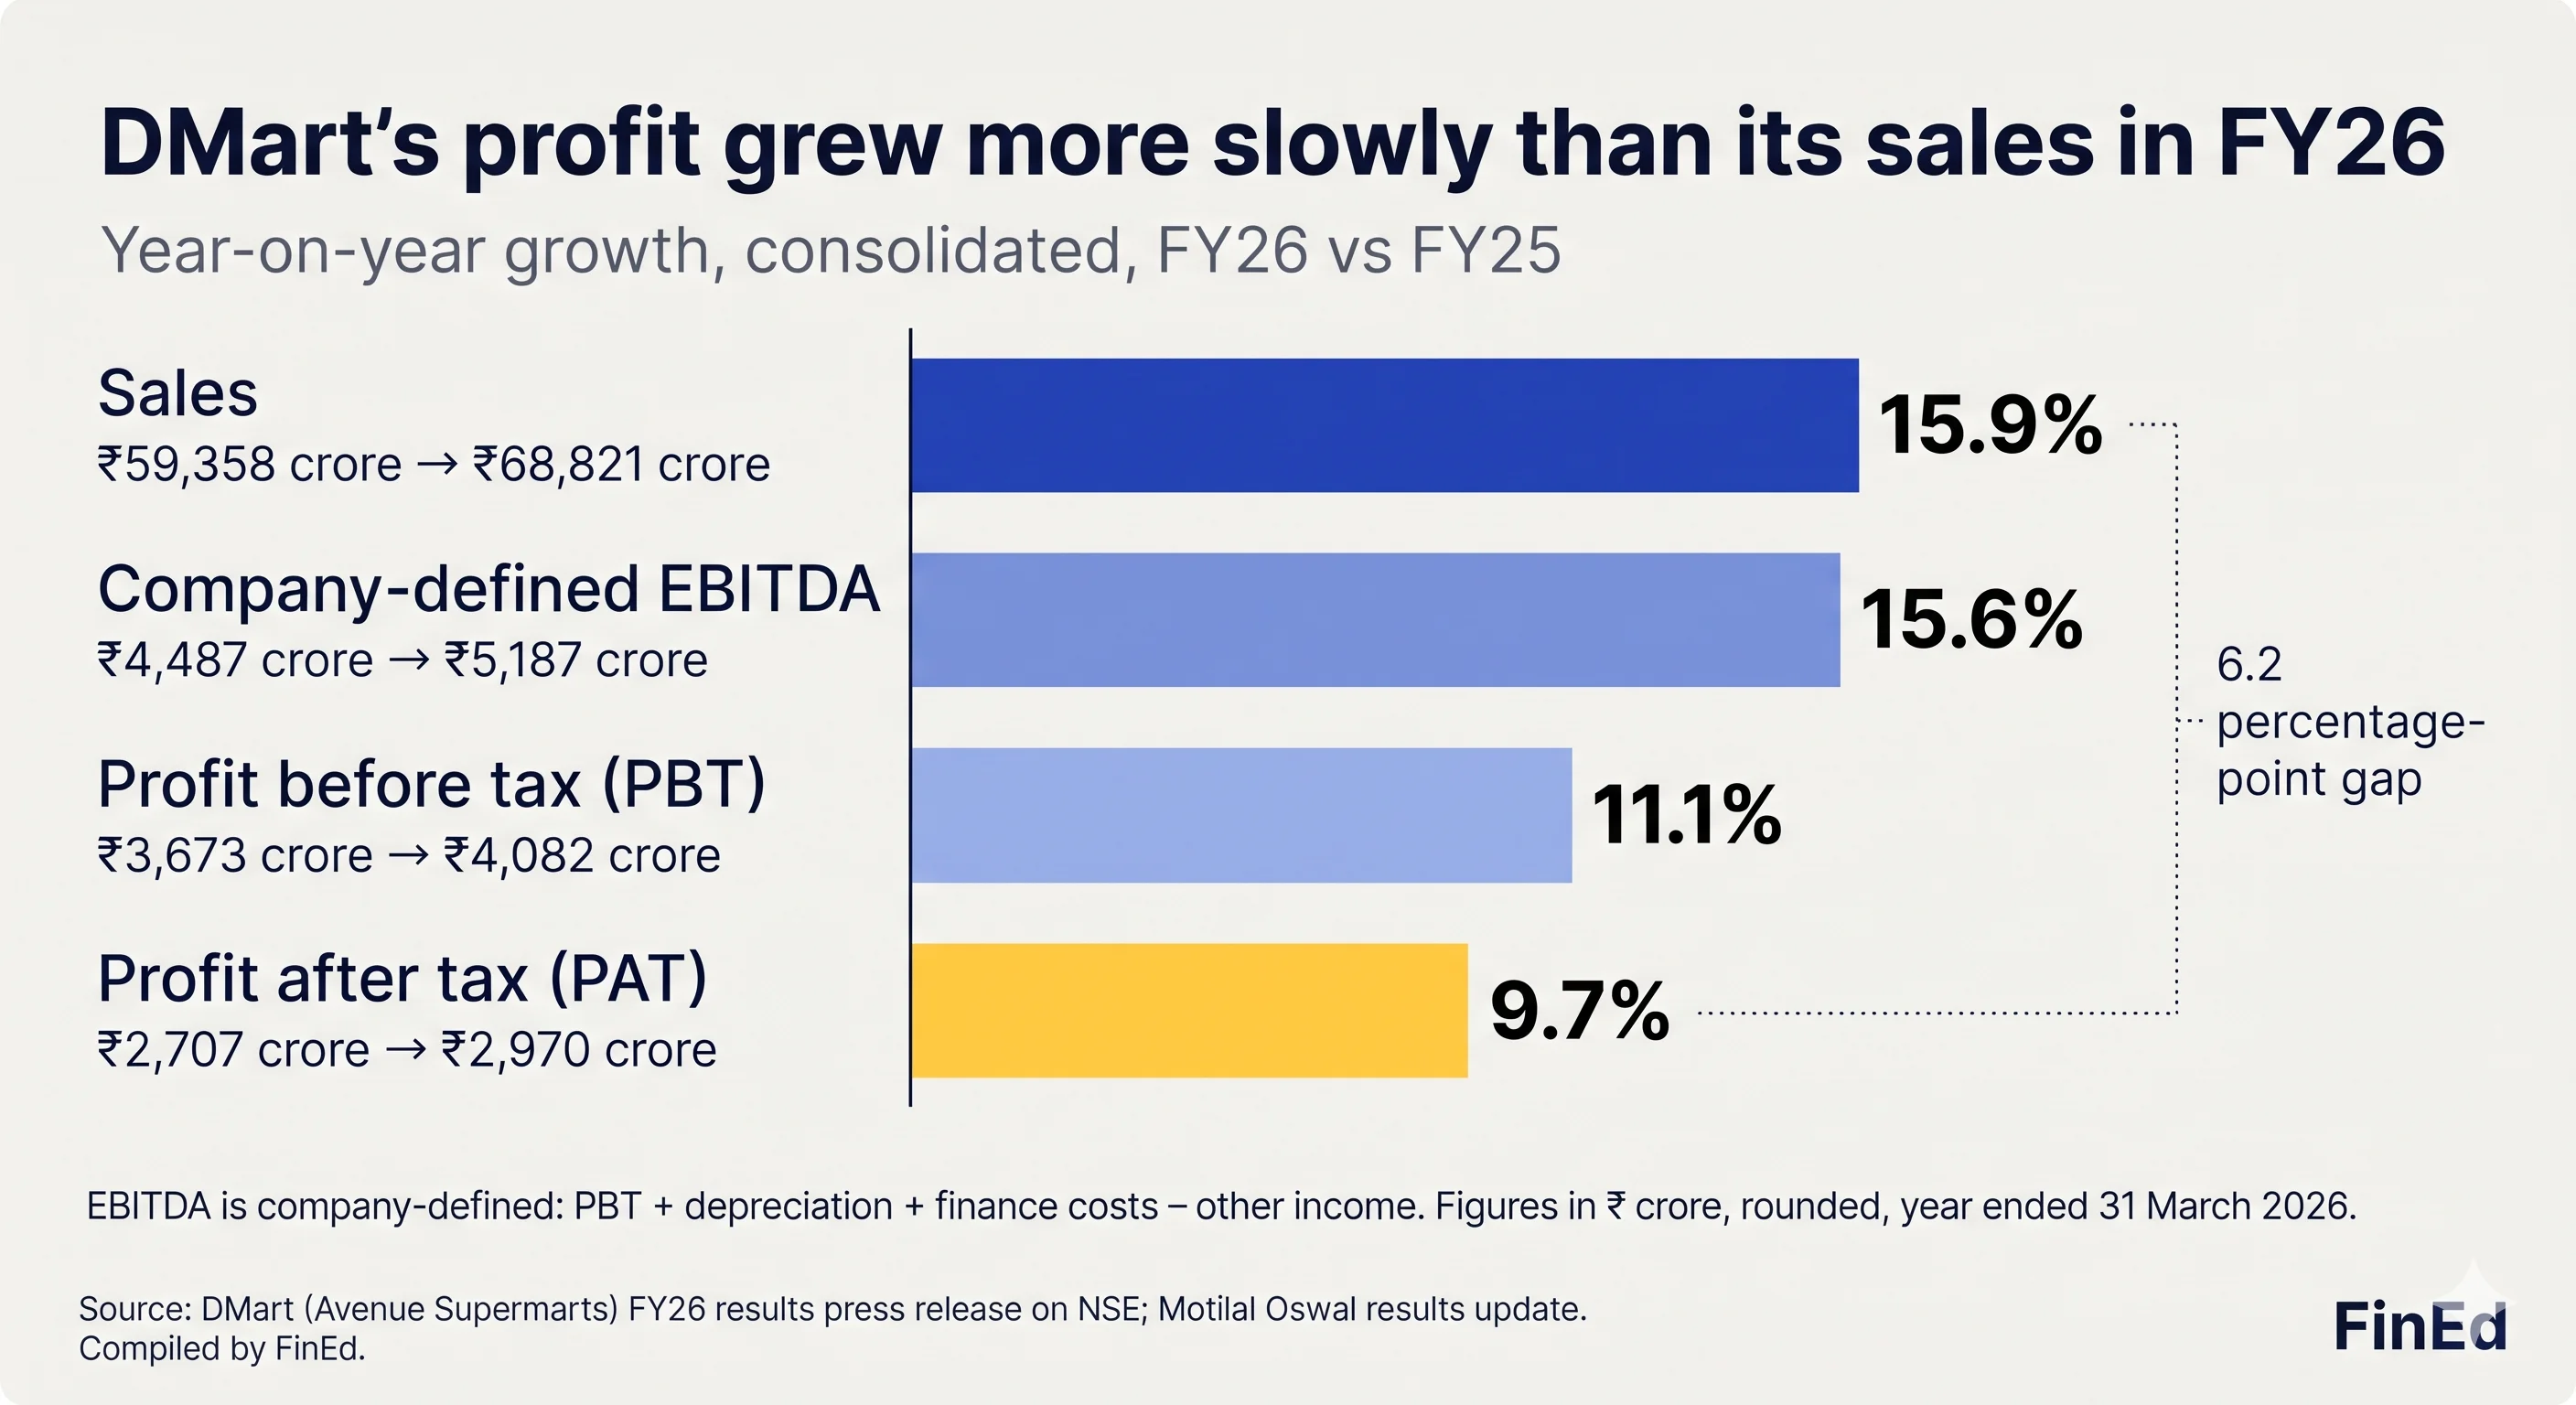
Sales and EBITDA grew almost together. Employee costs rose 32.2% to ₹1,541 crore, but a better gross margin kept EBITDA in step with sales. The slowdown came further down. Of the extra ₹700 crore or so of EBITDA, about ₹168 crore went to higher depreciation, which rose 19.3% to ₹1,037 crore. Another ₹73 crore went to finance costs, which roughly doubled from ₹69 crore to ₹142 crore. Other income fell by about ₹50 crore. That left PBT up by about ₹409 crore.
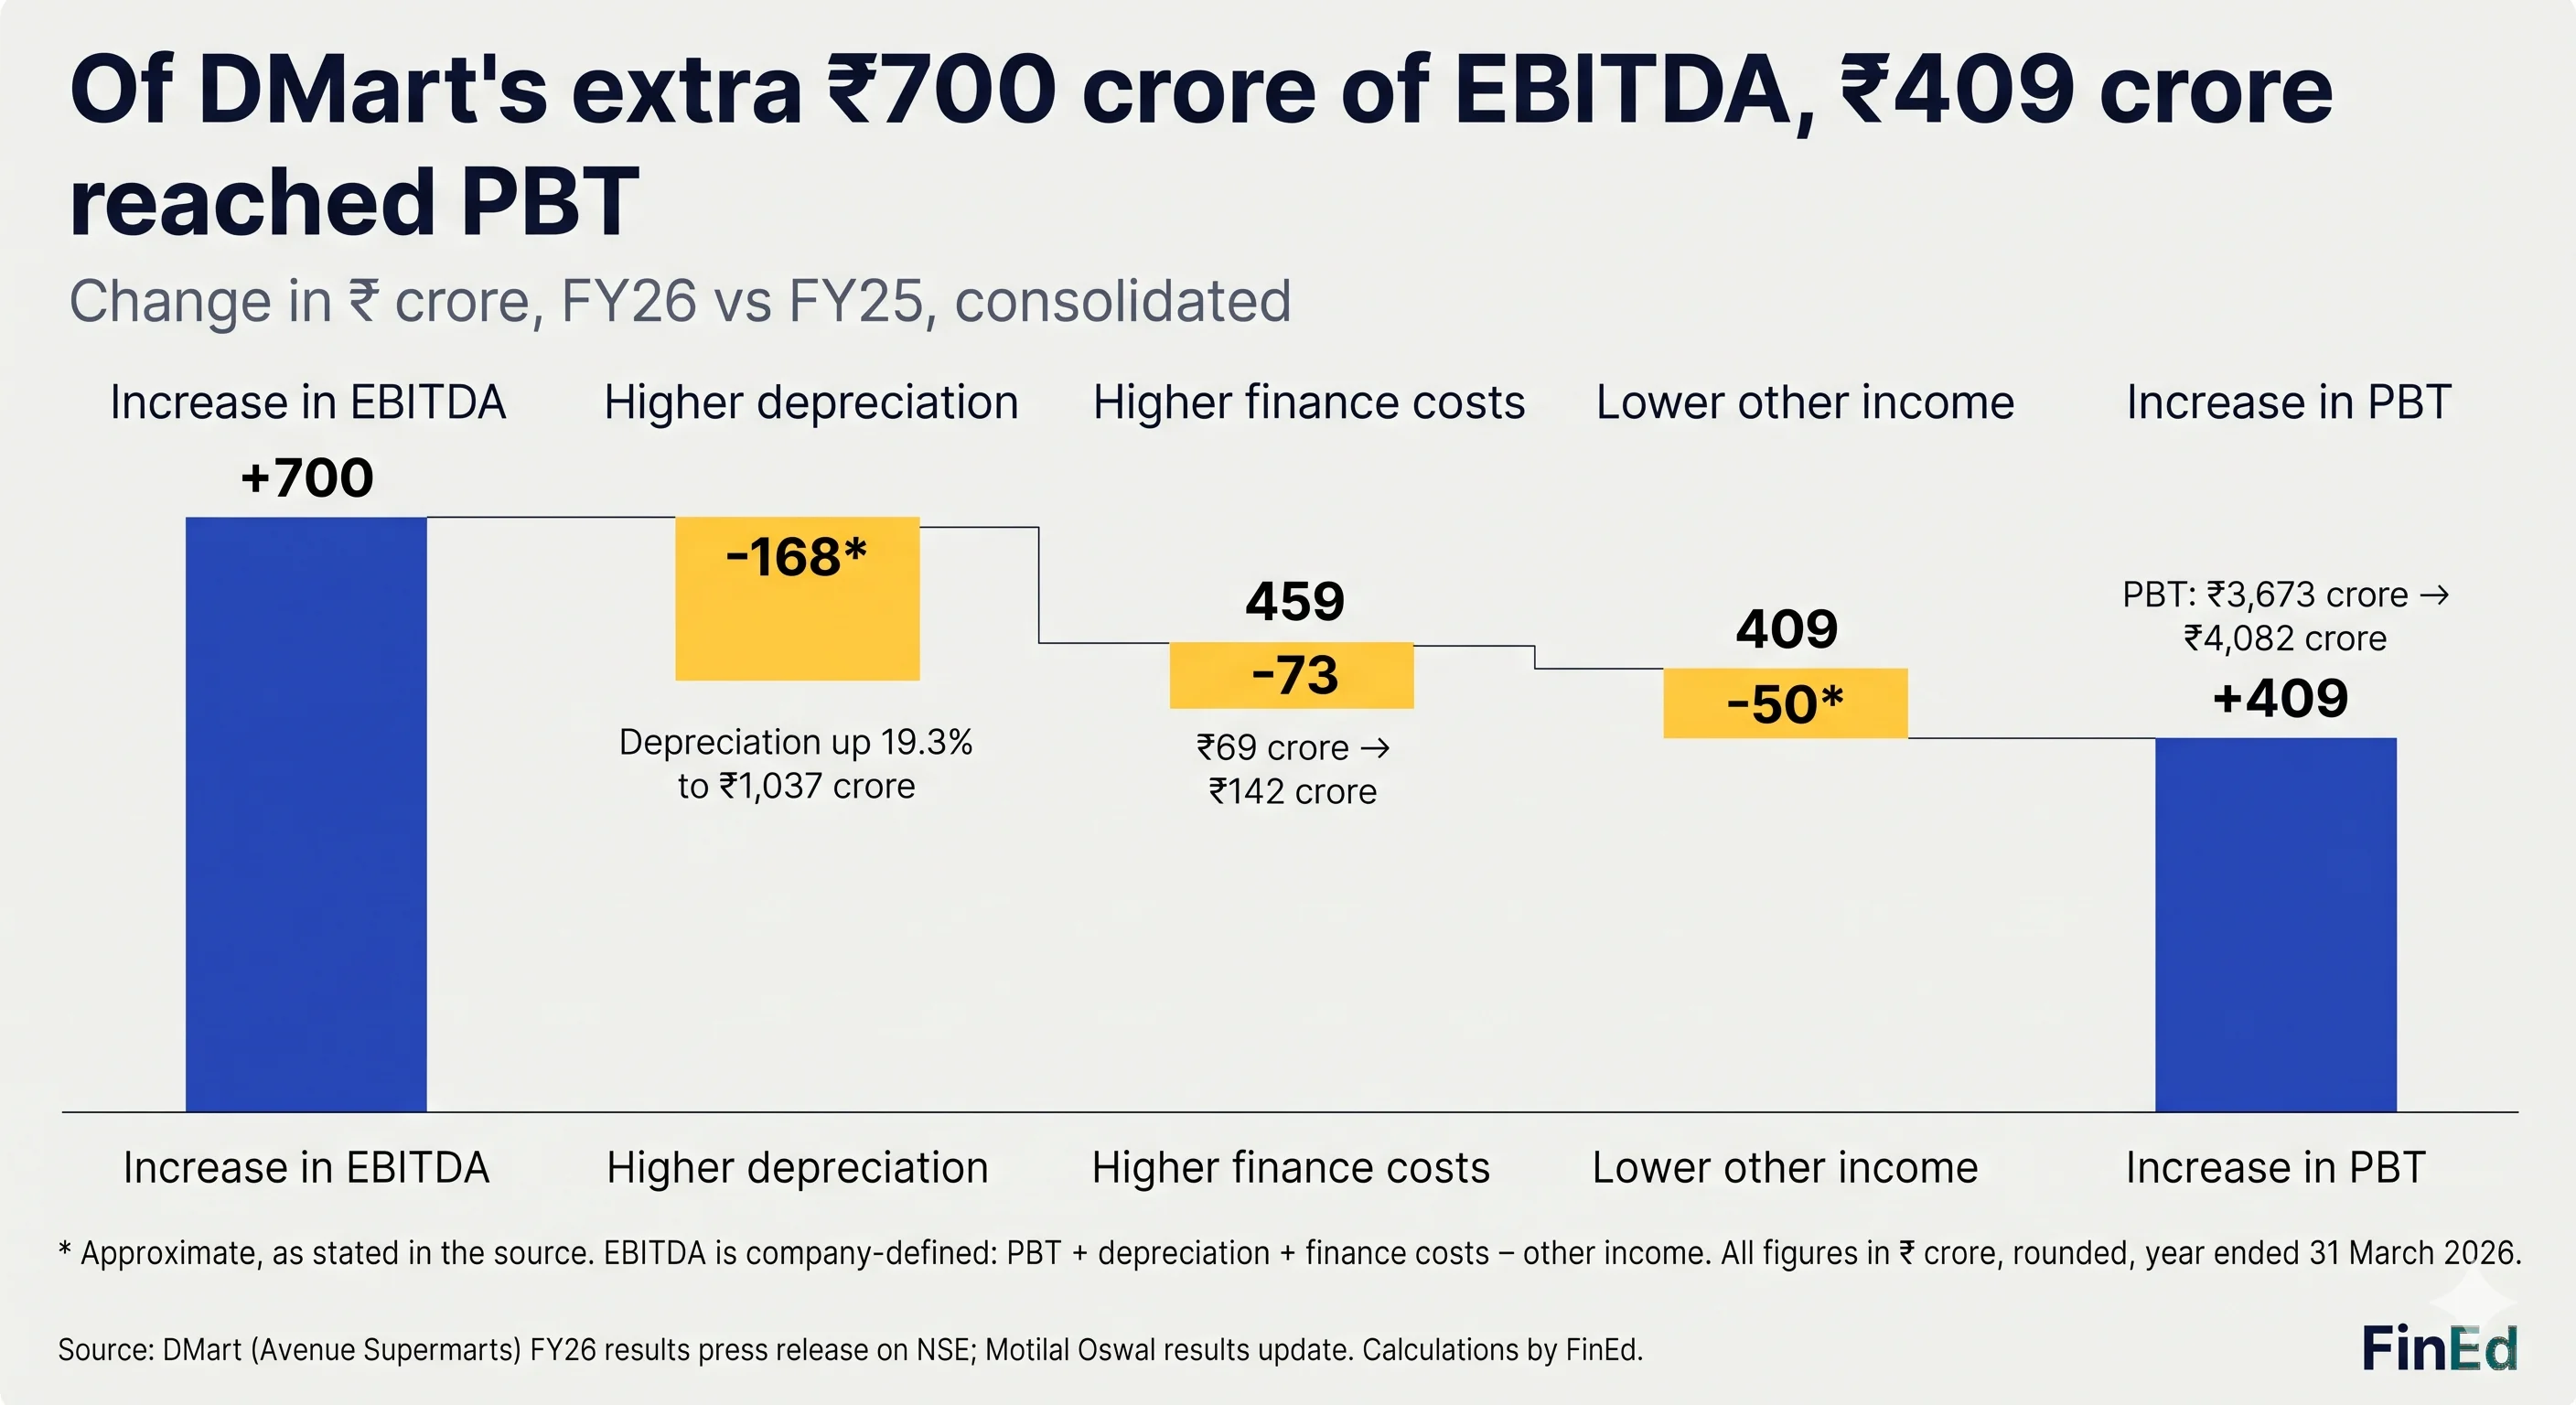
Why did costs climb? Motilal Oswal’s analysts linked the jump in employee costs to the pace of store openings, and DMart added 85 stores in FY26. DMart also took on about ₹965 crore of borrowings after having none a year earlier, and its lease liabilities rose too. That’s context, not proof the investment will pay off.
Tax played a part as well. DMart’s effective tax rate (tax as a share of PBT) rose from about 26.3% to 27.2%, which is why PAT growth of 9.7% trailed PBT growth of 11.1%.
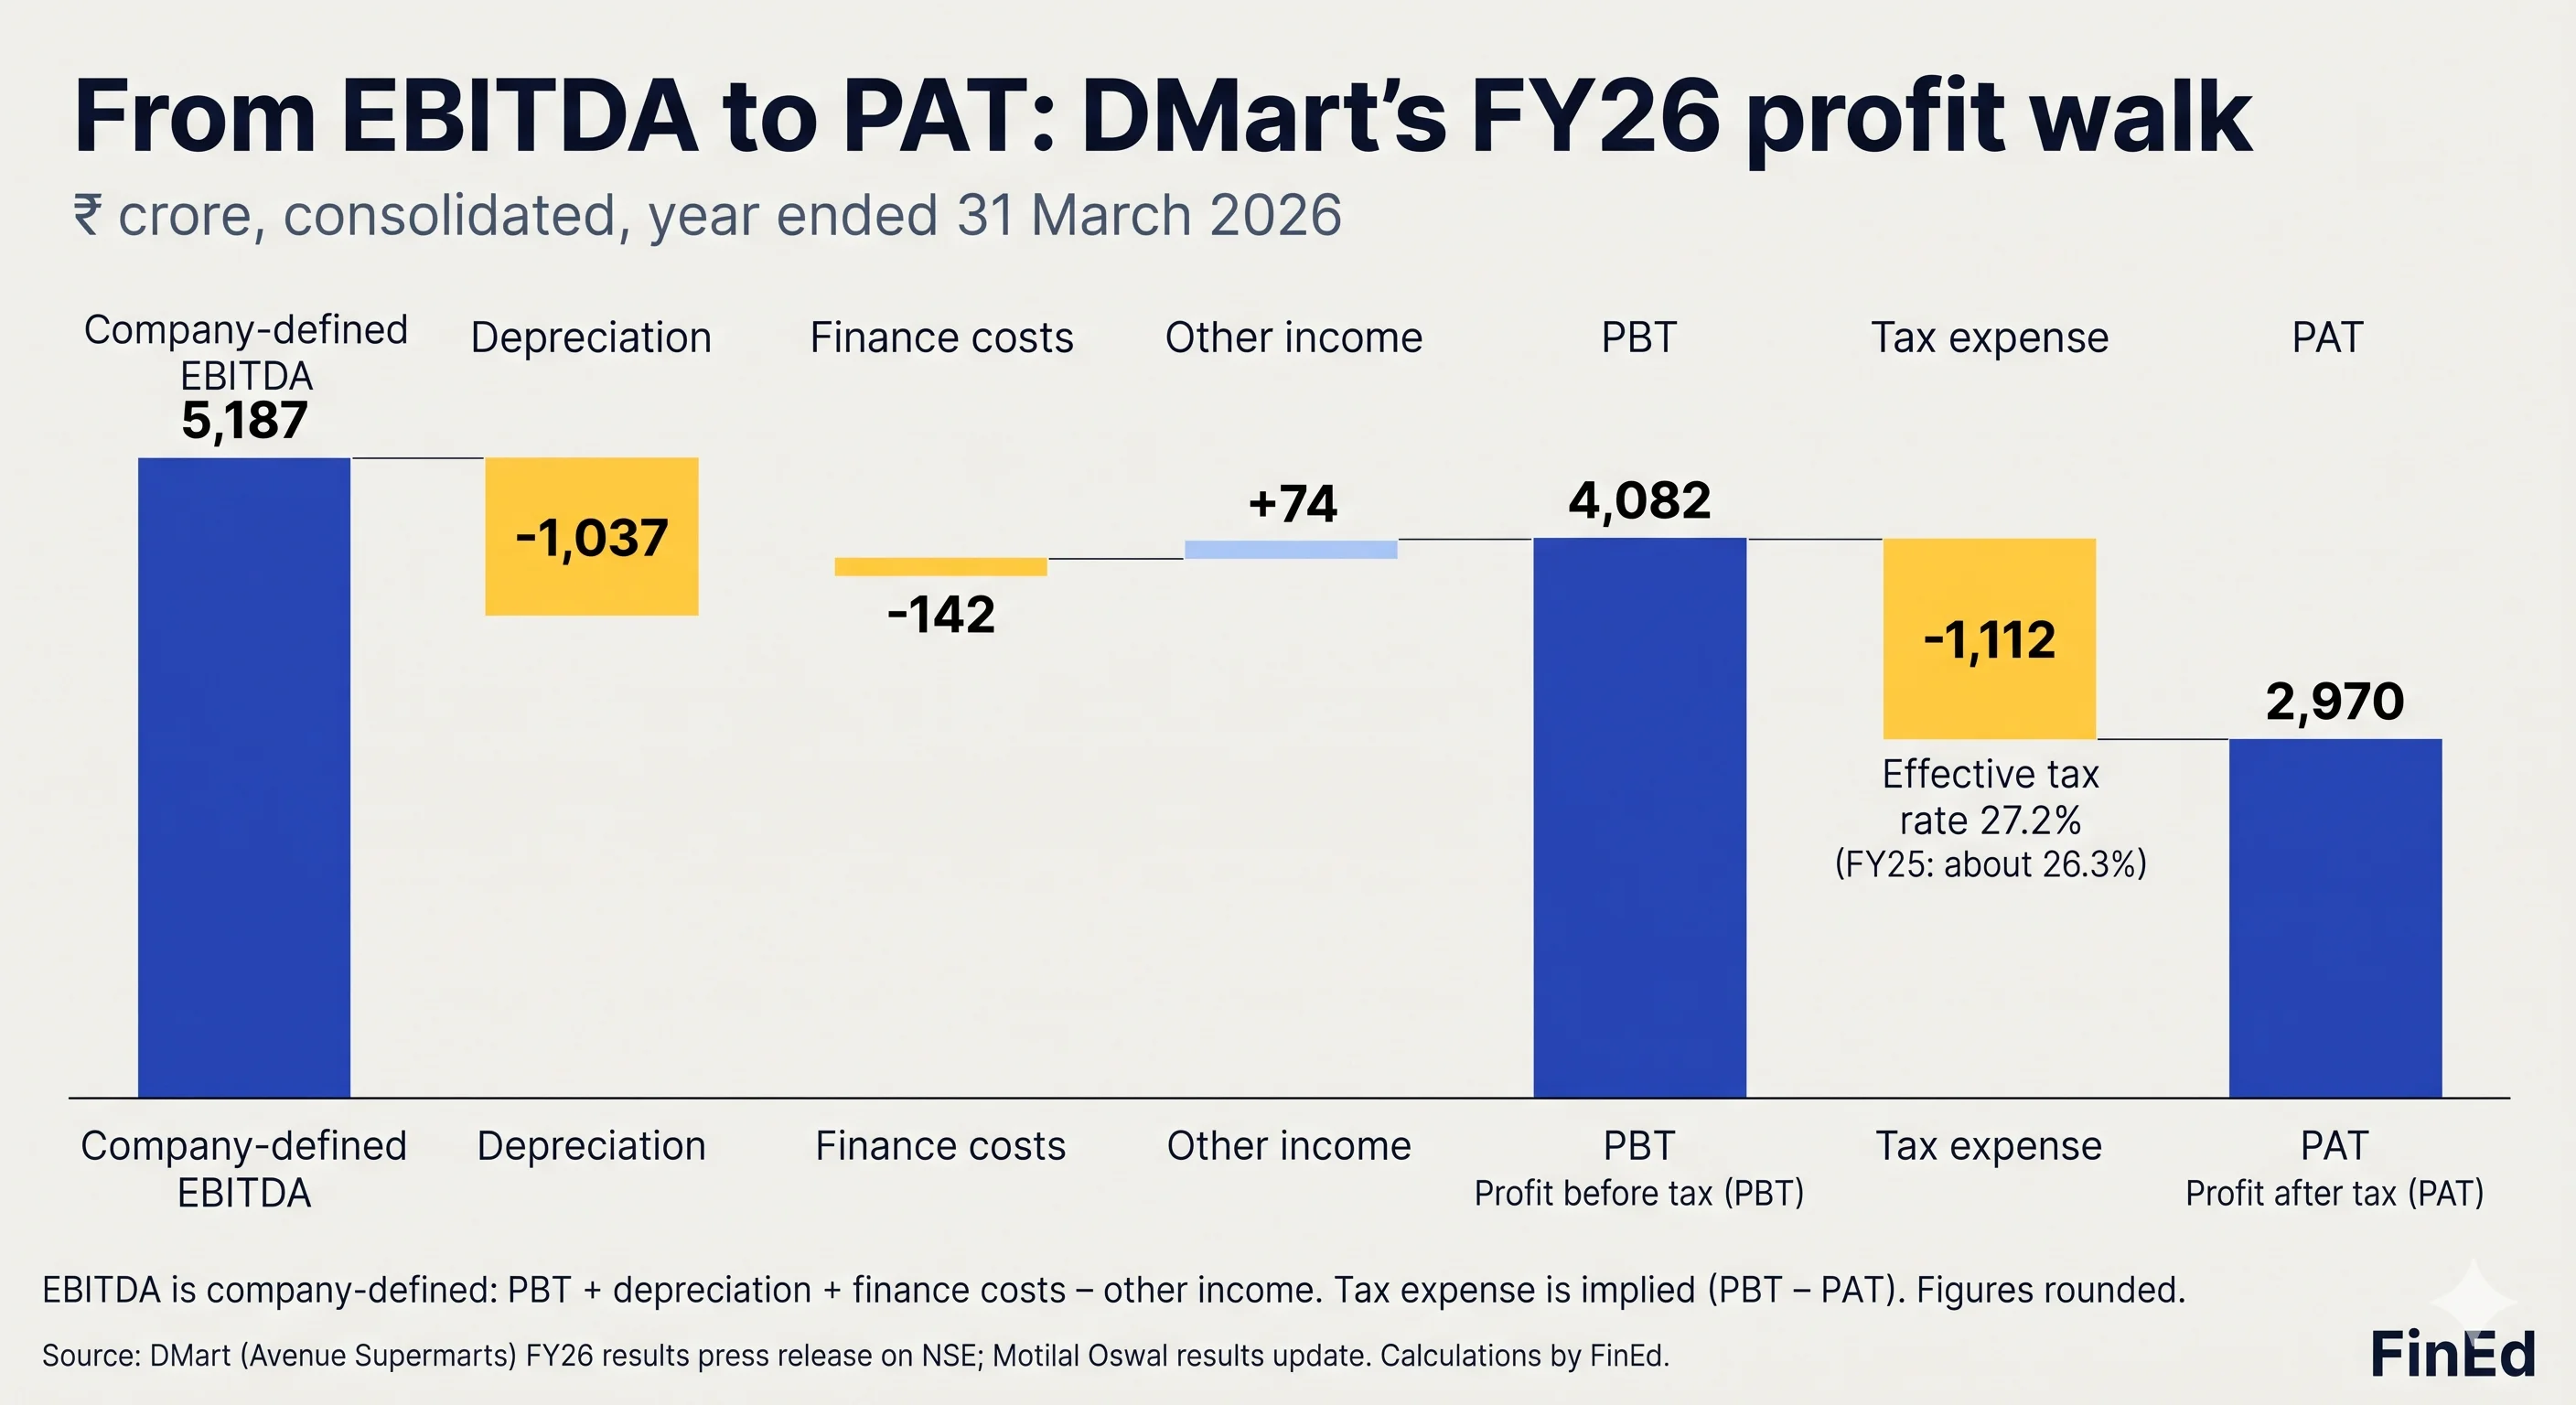
So the business sold more, but profit didn’t rise equally fast. The next step is to inspect each line of that bridge, not to declare the company good or bad. To see how DMart earns in the first place, read why DMart makes more money than other supermarkets.
Where Can You Find a Company’s P&L?
Open the company’s investor relations page, such as DMart’s, download the annual report and search for “Statement of Profit and Loss”. NSE and BSE also host the results and annual reports that listed companies file. Confirm whether the statement is standalone or consolidated, and follow the note numbers for details on major expenses.
Listed companies also publish quarterly results, so compare equivalent periods, such as one March quarter with the previous one. Under SEBI’s listing rules, quarterly results are due within 45 days of quarter-end and annual results within 60 days of the financial year-end. Quarterly figures are typically limited-reviewed, a lighter check by the auditor, while annual figures are fully audited.
One caution: profit isn’t cash. Revenue and costs are recorded when they happen, not always when money moves, and depreciation involves no cash going out. The cash-flow statement tells that story.
Conclusion
So how do you read a P&L? In two directions. Top to bottom, to see how revenue becomes profit. Side by side, to see what changed from last year.
DMart shows why both matter. Sales rose 15.9%, yet PAT rose 9.7%, with depreciation, finance costs, lower other income and a higher tax rate shaping the gap. Headlines give you the number. The statement shows you the questions behind it.
But the P&L only shows performance over a period, not what a company owns or owes. That’s the job of the balance sheet, which we’ll tackle in the next part of FinEd Decodes.
Key Takeaways
- Check the period, units and standalone or consolidated basis before reading any number.
- Follow revenue through expenses to PBT and PAT, and don’t subtract interest twice.
- Gross profit, EBITDA and PAT are different measures, so check each definition before comparing.
- Compare growth rates and margins across years, then investigate what changed.
- Profit isn’t cash, so pair the P&L with the cash-flow statement and balance sheet.